
INTRODUCTION
Endovascular thrombectomy (EVT) is an intraarterial treatment for acute cerebral infarction due to anterior circulation large vessel occlusions (ACLVOs). The reperfusion accomplished by EVT may prevent the progression of cerebral infarction caused by the occluded vessels. Prior randomized controlled studies have shown that EVT could be the standard care for patients with ACLVO [1-5].
Parenchymal hematoma (PH) may occur in association with EVT for ACLVO. The posttreatment PH may negatively impact the outcome of patients who have undergone EVT. A multicenter study of 13 stroke centers retrospectively gathered patients who underwent EVT to treat ACLVO. The incidence of posttreatment PH increased with an odds ratio of 3.53 in patients with EVT for ACLVO. The occurrence rate of posttreatment PH was 8.5%. In the multicenter study, atrial fibrillation was a risk factor for PH, but intraarterial tissue plasminogen activator (IA tPA) reduced the occurrence of PH [6]. Another single-center study also presented a 9.0% prevalence of posttreatment PH after EVT for an ACLVO. In that study, hyperlipidemia and successful reperfusion reduced the occurrence of PH, while hypertension and longer procedure duration increased the occurrence of PH [7].
The European Cooperative Acute Stroke Study (ECASS) categorized hemorrhagic transformation (HTR) into hemorrhagic infarction (HI) and PH [8]. For the patients treated by EVT, the impact of PH is more crucial than that of HI [6]; therefore, we focused on PH for this study.
A few studies have examined the factors that predict the PH after treatment with EVT in patients with ACLVO. The primary purpose of this study is to find the predictors of post-treatment PH associated with EVT. The secondary purpose of this study is to develop a tool that can be used to predict the risk of developing PH after performing EVT for ACLVO.
METHODS
Patient selection
Consecutive patients with acute ACLVO treated by EVT at the Cerebrovascular Center at Gyeongsang National University Hospital were enrolled retrospectively. The recruitment period was from February 2016 to November 2018. We included patients only when the occlusion site was the internal carotid artery (ICA) or the M1 segment of the middle cerebral artery (MCA). Unilateral occlusions of an anterior cerebral artery (ACA) were not enrolled in this study because we do not perform EVT in those cases. Patients treated with EVT in this study were those who were within 24 hours after ACLVO and had sufficient ischemic penumbra as evaluated by brain imaging.
We excluded patients with any of the following: no initial magnetic resonance imaging (MRI), no follow-up MRI within 1 week, and in-hospital stroke. The reason for the exclusion of the patients with an in-hospital stroke was the lack of data on the initial laboratory findings and initial blood pressure. Finally, 233 patients were enrolled in this study.
Extraction of data
The demographic and clinical information obtained from the electronic medical records are summarized in Table 1. The variables associated with the EVT procedures were also from the medical records and are summarized in Table 2. The demographic and clinical information were as follows: demographics (age, sex), infarction state (basal ganglia involvement, occlusion location, embolism, initial pattern of infarction, and National Institute Health Stroke Scale [NIHSS] score at admission time), medical history (hypertension, diabetes, prior stroke or transient ischemic attack, smoking, coronary heart disease, atrial fibrillation, and/or hyperlipidemia), and current medication (oral anticoagulants, antiplatelet drugs, antihypertensive drugs, antidiabetic drugs, and/or statins). In this study, the subtypes of ischemic stroke were classified into two categories, embolic stroke, and large artery disease. Embolic strokes included cardiogenic embolism and embolic stroke of undetermined source [9].
The extracted variables associated with the EVT procedure were as follows: initial laboratory and clinical findings (serum glucose levels, prothrombin time international normalized ratio [PT INR], hemoglobin A1c, and systolic blood pressure), and interventions (intravenous recombinant tissue plasminogen activator, use of balloon guiding catheter, thrombectomy technique, use of tirofiban during EVT, intervals from symptom onset to puncture time, number of retrievals, and procedure time).
In this study, we classified the PH according to the ECASS criteria [8]. The ECASS classification grades PH as PH type 1 (PH1) and PH type 2 (PH2). PH1 is the hematoma that occupies less than 30% of the infarcted area. PH2 is the hematoma occupying more than 30% of the infarcted area and has a significant space-occupying effect. To determine the grade of the PH, each of the two authors (CHK and JK) evaluated the cases independently. If the decision was not initially concordant between them, a consensus was achieved through discussion.
The state of reperfusion after EVT was defined based on the Treatment in Cerebral Ischemia Scale (TICI) [10]. In the TICI scale, the degree of perfusion after vascular therapy for acute ischemic stroke has five grades: grade 0, grade 1, grade 2a, grade 2b, and grade 3. Grade 0 means no perfusion, and grade 3 indicates complete reperfusion of the prior occlusion of the target artery and its distal branches. We defined complete reperfusion as the vascular state of TICI grade 3 for this study.
EVT procedure
Three interventionists (DSC, CHK, and JK) performed the procedures in all recruited patients according to their shift schedule. They obtained digital subtraction angiography images by placing a guiding catheter at the cervical segment of the ICA or the common carotid artery. Those images were used to evaluate the occlusion site of the cerebral infarction.
For EVT, they used a stent retriever or a direct aspiration catheter with a femoral artery approach under conscious sedation. In the case of using the stent retriever, they inserted the microcatheter under the guide of a microwire. After locating the microcatheter at the distal part of the clot, they captured the clot with the stent retriever deployed across the clot. They then retrieved the stent device through the guide catheter while aspirating with a 50 mL syringe. In cases of using a direct aspiration catheter, they located the catheter at the proximal end of the clot. In that state, they performed the aspiration using a 50 mL syringe through the aspiration catheter.
When successful recanalization was not achieved with one of the two devices, they also used the other device. If they found chronic severe stenosis of the target artery, they additionally administered intraarterial tirofiban up to 2 mg to prevent reocclusion. Just after finishing the entire procedure, another angiography was performed to evaluate the degree of recanalization.
Statistical analysis
We grouped the patients into two groups to compare the extracted factors between the two groups: patients with PH and patients without PH. For simple comparisons of variables, we used chi-square tests for categorical variables and Student t tests for continuous variables. We converted the glucose level at EVT to a binary variable: <145 and ≥145 mg/dL. In addition, we calculated the interrater kappa regarding the decision as to the presence or absence of PH between the two authors (CHK and JK) to provide the degree of accuracy of the decision.
For the regression analysis, we performed a univariate regression of the extracted variables first to find factors that had significant effects on the occurrence of PH. For this univariate regression, we set the level of significance as P<0.2. Next, we performed a binary multivariate logistic regression for the factors against the occurrence of PH. For this multivariate regression, we set the level of significance as P<0.05. For these statistical analyses, we used IBM SPSS Statistics software ver. 25 (IBM Corp., Armonk, NY USA).
Through gathering the significant factors from the binary multivariate regression, we developed a clinical inventory tool to predict PH associated with EVT. For the validation of the inventory tool, we performed receiver operating characteristic (ROC) curve analyses using MedCalc software ver. 8.0 (MedCalc Software BVBA, Ostend, Belgium). The ROC curve analyses determined the most appropriate cutoff score when the Youden’s J index was the highest, the area under the curve (AUC) value, and other statistical results from the case. Additional statistical analyses were performed to observe how the AUC value changes as the cutoff score changes. Whenever the cutoff score was changed, we added ROC curve analyses repeatedly after artificially converting the GuEss-MALiGn scale score to a binary classification based on the individual case.
RESULTS
Characteristics of the patients
The mean age of the enrolled 233 patients was 72.3 years old, with a standard deviation (SD) of 11.3. One hundred eight of the patients were male (46.4%). PH after EVT occurred in 18.0% (n=42) of the enrolled patients. According to the subtype of PH, the occurrence rate was 12.9% (n=30) for PH1 and 5.2% (n=12) for PH2. The interrater agreement rate for the decision of PH was 99.6% between the two investigators (CHK and JK), and the kappa value of the agreement was 0.875±0.41 (P<0.01).
Comparisons of demographic and clinical characteristics between the non-PH and PH groups
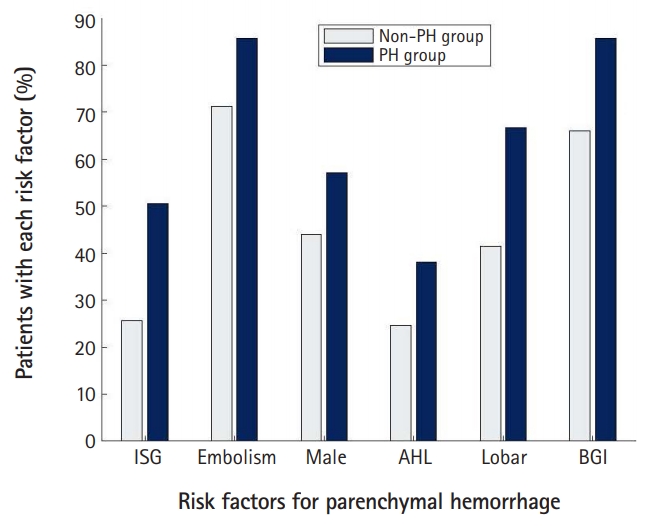
The number of enrolled patients who underwent EVT for ACLVO was 233. We summarized the demographic and baseline clinical characteristics with the comparison between the non-PH and PH groups in Table 1, Fig. 1. Basal ganglia involvement and lobar infarction were significantly different between the two groups (P<0.05). The percent of basal ganglia involvement was 66.0% and 85.7% for the non-PH and PH groups, respectively. The rate of lobar infarction was 41.4% and 66.7% for the non-PH and PH groups, respectively.
Differences between the two groups for age, sex, location of thrombus, embolic infarction, the NIHSS score at the admission time, previous medication use, smoking history, and previous medical history in the univariate analysis did not reach the level of significance. The mean age of the non-PH and PH groups was 72.4±11.6 and 71.8±9.6 years, respectively. For the non-PH and PH groups, the male proportion was 44.0% and 57.1%, respectively; the frequency of embolic infarction was 71.2%, and 85.7%, respectively; and the rate of antihyperlipidemic use was 24.6% and 38.1%, respectively. The proportion of patients using antithrombotics as a preexisting treatment was 36.6% for the non-PH group and 40.5% for the PH group.
For patients included in our study, the occlusion was located in either the ICA or the MCA, for 29.8% and 70.2%, respectively, in the non-PH group, and 31.0% and 69.0%, respectively, in the PH group. There was no case where the ACA was the occlusion site. For cases of solitary and unilateral ACA occlusion, we do not perform EVT treatment. For this reason, this study excluded cases with solitary ACA occlusion.
Comparison of factors associated with the EVT procedure between the non-PH and PH groups
We summarized the factors associated with the EVT procedure with a comparison between the two study groups in Table 2, Fig. 1. The initial glucose level was significantly different between the two groups. The incidence of the initial glucose level equal to or higher than 145 mg/dL was 25.7% and 50.0% in the non-PH and PH groups, respectively. IV thrombolysis, onset to puncture time, initial systolic blood pressure, baseline INR, balloon guiding catheter, thrombectomy technique, use of tirofiban, complete reperfusion, and procedure time were not significantly different between the two groups in the univariate analysis. The onset to puncture time in the non-PH group was 408.9±372.9 minutes, and 385.7±239.5 minutes in the PH group.
Binary logistic regression analysis
Univariate regression
Nine factors were significantly associated with the occurrence of PH (P<0.2): male sex, embolism, basal ganglia involvement, lobar infarction, antidiabetic use, antihyperlipidemic use, diabetes mellitus history, NIHSS score, and initial serum glucose level (Table 3).
A clinical inventory tool for predicting PH associated with EVT
GuEss-MALiGn scale
We developed a clinical inventory tool to predict PH associated with EVT, with the six significant factors obtained through multiple regression analysis. We named this as "GuEss-MALiGn scale" using the six upper case characters to indicate the six predictors: serum glucose level at EVT (G), embolic infarction (E), male sex (M), antihyperlipidemic use (A), lobar infarction (L), and basal ganglia involvement (G). All six predictors were binary conversions making it convenient to compose a six-item Likert scale inventory. For each item, the score is 0 or 1, according to the state of each patient being assessed. Therefore, the range of the total score of the GuEss-MALiGn scale is 0–6.
The optimal cutoff point for the high risk of PH
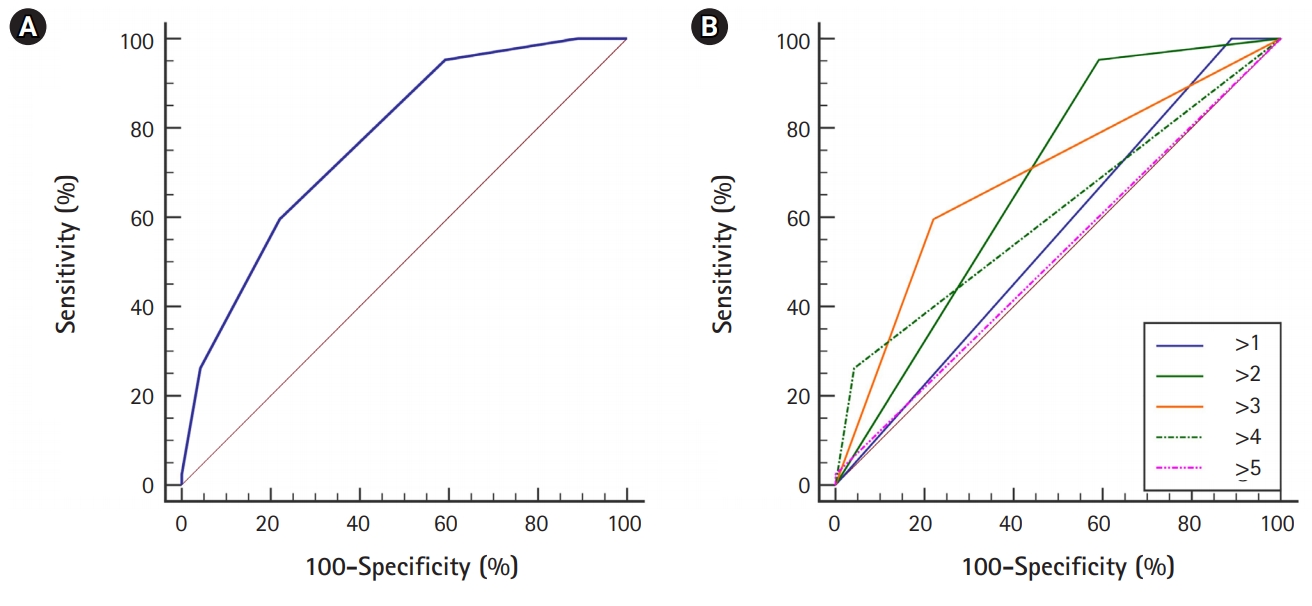
For the patients in this study, the mean score of the GuEss-MALiGn scale was 2.9±1.1. Table 4 shows the results of the ROC curve analysis of the score of the GuEss-MALiGn scale for predicting a high risk of PH associated with EVT, and Fig. 2A shows the ROC curve drawn by the analysis. The GuEss-MALiGn scale score was suited for discerning a high risk of PH associated with EVT (AUC, 0.771; P<0.0001; 95% confidence interval, 0.712 to 0.824) (Table 4, Fig. 2A). The optimal cutoff point was >3. At the cutoff point of >3, the sensitivity and specificity were 59.5% and 78.0%, respectively, with a positive predictive value of 37.3% and a negative predictive value of 85.5%. To observe how the AUC changes as the cutoff score shifts, we conducted additional statistical analyses. Even in this comparison between the different scores, when the cutoff point was >3, the AUC value was at its highest, at 0.688 (Table 5, Fig. 2B).
DISCUSSION
Posttreatment PH associated with EVT results in adverse impacts on the outcome of patients with ACLVO. PH increased poor functional outcomes by 6.24 times and mortality by 3.53 times in a multicenter study [6]. Through ROC curve analyses, we proved that the GuEss-MALiGn scale was clinically useful to predict the posttreatment PH. The optimal cutoff point of the GuEss-MALiGn scale for predicting the PH was more than 3 points. The GuEss-MALiGn scale may help us identify patients with a high risk of PH associated with EVT. We could provide particular attention and effort toward reducing PH for the patients determined to be at high risk by the GuEss-MALiGn scale.
Studies regarding the occurrence rate of PH associated with EVT in patients with ACLVO are scant. Nogueira et al. [6] gathered patients with ACLVO who underwent EVT within 8 hours after EVT from 13 stroke centers. The rate of PH associated with EVT was 8.5% among the enrolled patients [6]. Lee et al. [7] also recruited patients with EVT for ACLVO in a single-center study, and the rate for PH was 9.0% in their collection. In our study, PH occurred in 18.0% of enrolled patients. There was a marked difference in the rate between our study and the previous two studies.
There are a number of potential reasons for the difference in the occurrence rate of PH associated with EVT between the previous studies and our study. One plausible explanation is that the imaging modalities for determining the occurrence of PH were different among the studies. Small PHs, which are not easy to detect with computed tomography (CT), will be detected more frequently by MRI. Nogueira et al. [6] evaluated the PH associated with EVT with CT as well as MRI, and Lee et al. [7] used only CT. Meanwhile, we defined the occurrence of PH using MRI in all enrolled cases. Considering the difference in imaging modalities, we calculated the occurrence rate of PH2. PH2, whose size was defined as more than 30% of the infarcted area, occurred in 5.2% of enrolled patients in our study. The occurrence rate of PH2 was less than that of PH in the two previous studies [6,7]. The two previous studies did not report the occurrence rates of PH2. Visual inspection may similarly detect massive bleeding between the CT-based and MRI-based decision paradigms, so our incidence of PH2 might have been similar to the previous studies.
In the study by Nogueira et al. [6], the use of IA tPA was a beneficial factor in reducing the posttreatment PH. In contrast, the effect of IA tPA could not be evaluated in our research because we did not use IA tPA in our enrolled patients. The lack of IA tPA use might explain the higher rate of PH in our study than in their previous study. The occurrence rate of the PH2 subset in our study was less than that of total PH in the previous two studies. The use of IA tPA might have reduced the occurrence of small hemorrhages in the previous study because the occurrence rate was markedly less than that in our research.
Six items in the GuEss-MALiGn scale are known to be associated with the HTR of cerebral infarction. A previous study also showed that the basal ganglia infarction occurred before the EVT treatment and was associated with the risk of HTR in patients with ACLVO [11]. HTR is associated with reperfusion after occlusion on the perforators, which are more vulnerable to blood brain barrier failure than larger arteries are [12]. Hyperperfusion after reperfusion and restoration of blood pressure associated with embolic infarction can damage brain parenchyma and cerebral vessel walls [13]. Therefore, embolism is a risk factor for posttreatment PH, and its effect was independent of anticoagulant or antithrombotic use [14,15]. Intracerebral hemorrhage in the general population was more prevalent in males than females in an epidemiological study performed in Japan [16]. As shown in the results of our study, the PH associated EVT treatment may also occur more frequently in males.
Hyperlipidemia is a beneficial factor for the prevention of posttreatment PH [7,17]. A low level of serum cholesterol can enhance the necrosis of smooth muscle cells in the medial layer of the artery. The vascular endothelium, damaged by the low level of serum cholesterol, may be an ideal site for the development of microaneurysms [18]. Brain edema caused by massive cerebral infarction compresses and damages the vasculatures peripheral to the volume of the infarction. Delayed perfusion that occurs after resolution of the edema increases the likelihood of HTR in damaged blood vessels [19-22]. Hyperglycemia causes diffuse damage in the microvasculature, increasing the volume of the cerebral infarction. The increment of infarct volume increases the risk of HTR [23-26].
There were several limitations to this study. Firstly, the most significant limitation of our proposed GuEss-MALiGn scale is that there has not yet been external validation. In the future, additional validation performed with patients extracted from other populations will improve the efficacy of the GuEss-MALiGn scale. Secondly, the sensitivity of the GuEss-MALiGn scale was relatively low at 59.5% for detecting PH after EVT. Contrastingly, the specificity was a reasonable 78.0%, and this may make the GuEss-MALiGn scale clinically significant when the score indicates a high risk of PH occurrence. Thirdly, we did not obtain the Alberta Stroke Program Early CT Score (ASPECTS), which is a surrogate for infarction volume. Nevertheless, in this study, we analyzed the involvement of the basal ganglia and lobar infarction as substitutes for the ASPECTS score. Both were significant EVT-related risk factors for PH. Fourthly, there may have been bias in the patient selection as this study was a retrospective study from a single center. Therefore, there is a possibility that cultural aspects deriving from the local area might have affected the outcome results. Lastly, a difference in the skills among the interventionists might have affected the outcome of EVT.