급성기 허혈성 뇌졸중에서의 장기적 신경학적 예후와 혈중 D-dimer 농도와의 임상적 연관성
Clinical Correlation between Plasma D-Dimer Level and Long-Term Neurological Outcome in Acute Ischemic Stroke
Article information
Trans Abstract
Background:
D-dimer is a reliable and sensitive index of fibrin deposition and stabilization. It is well known that D-dimer levels are significantly associated with cardioembolic infarction and are elevated during the acute phase of cerebral infarction. Several studies also suggest a possible role of D-dimer in the early prognosis of ischemic stroke. However, it is controversial whether D-dimer can also predict the long-term outcome following ischemic stroke. Therefore, the purpose of this study is to investigate the effect of plasma D-dimer level at admission on long-term functional outcome after ischemic stroke.
Methods:
We recruited 246 patients with acute ischemic stroke. All subjects had their plasma D-dimer levels evaluated and checked by the modified Rankin scale (mRS) at discharge and at follow-up visits at 3 months, 6 months, and 9 months later. All subjects were divided into 4 groups according to mRS (mRS ≤2 vs mRS ≥3) and plasma D-dimer level (< 0.5 μg/ml vs ≥0.5 μg/ml) to investigate the relationship between plasma D-dimer levels and long-term functional outcome in patients with acute ischemic stroke.
Results:
There are no significant differences of age, gender and stroke risk factors among the 4 groups. The two patient groups with mRS ≥3 showed significant differences according to their plasma D-dimer levels. On the other hand, the two patient groups with mRS≤2 showed no significant differences according to their plasma D-dimer levels.
Conclusion:
We assume through this study that D-dimer levels play a role in long-term functional neurological outcome in ischemic stroke with severe neurological deficit. However, to clarify the role of D-dimer in stroke, future longitudinal studies involving a large cohort are required.
서 론
허혈성 뇌졸중 발생과 진행과정에서 혈소판은 중요한 역할을 한다. 이들 진행과정은 혈소판의 부착(adhesion of platelets), 분비반응(release reaction) 그리고 혈소판의 응집(aggregation)으로 구성된다[1]. 섬유소(fibrin)는 혈액응고(blood clot)에서 가장 중요한 구성성분으로서 정상적으로는 섬유소의 생성과 파괴가 동시에 일어난다고 알려져 있으며 이 평형상태 유지 상태를 가장 잘 반영하는 분자적표지자(molecular marker)는 D-dimer이다[2]. 즉, D-dimer의 특정 항원결정인자(epitope)에 대한 단클론항체(monoclonal antibody)는 교차 결합된 섬유소와는 반응하지만 섬유소분해산물(fibirinogen degradation products)이나 교차 결합하지 않은 섬유소분해산물과는 반응하지 않으므로 섬유소 생성 및 안정화에 대한 생물학적표지자로서 D-이합체는 높은 특이도를 갖는다[3].
D-이합체는 다른 트롬빈(thrombin) 형성을 측정하는 표지자보다 체외 활성화에 대해 저항력이 있고, 비교적 안정적이며 반감기가 길다는 장점을 가지고 있다[4]. 증가된 D-이합체 농도는 파종혈관내응고, 정맥혈전색전증, 허혈성 심질환, 뇌졸중, 그리고 혈전용해 치료를 포함하는 혈전과 관련된 임상 상태의 여러 질환과의 연관성이 보고되고 있다[5,6]. 따라서 D-이합체 검사는 정맥혈전색전증의 진단, 최초의 동맥 및 정맥혈전 발병 후 고위험 환자의 확인, 재발성 정맥혈전색전증의 고위험 환자 확인, 정맥혈전색전증 최초 발병 후 2차 예방적 치료의 최적기간의 결정 그리고 파종혈관내응고의 진단과 모니터링 등에 다양하게 적용되고 있다[3,7]. 더욱이 뇌졸중에 대해서는 피브리노겐, C-반응단백질보다 증상의 진행을 더 잘 반영한다고 알려져 있다. 따라서 급성기의 허혈성 뇌졸중에서의 혈중 D-이합체의 농도의 증가는 좋지 않은 결과를 반영하는 초기 진행의 예측인자로서 유용성이 있다고 제안하는 보고도 있다[6,8]. 하지만 급성기 허혈성 뇌졸중 증상의 조기진행 및 향후 장기간의 신경학적 기능적 예후까지 추정할 수 있는 표지자로서의 혈중 D-이합체의 임상적인 역할에 대한 연구는 매우 미미하여 본 저자들은 허혈성 급성기 뇌졸중 환자에 있어서 혈중 D-이합체 검사를 통해서 임상 증상의 경중에 따른 향후 신경학적 기능적 예후를 추정할 수 있는지에 대한 연구를 시도한다.
대상 및 방법
본 연구는 2011년 3월부터 2014년 3월까지 본원 신경과 및 응급실로 내원한 242명의 급성기 허혈성 뇌졸중 환자를 대상으로 하였다. 모든 환자는 확산강조영상이 포함된 뇌자기공명영상을 통해서 허혈성 뇌졸중을 진단하였으며, 증상발현 24시간이내 60세 이상 급성기 환자만을 본 연구에 포함하였다. 대상 환자 중 D-이합체에 독립적으로 영향을 줄 수 있는 최근 수술을 포함한 외상을 가진 경우, 간질환, 신장질환, 혈전용해 치료중인 경우, 패혈증 또는 폐렴 등 염증질환, 빈혈, 부정맥, 심장판막질환, 급성 허혈성 심질환, 종양, 뇌출혈 또는 일과성 허혈발작을 가진 경우는 본 연구에서 제외하였다. 각각의 대상군의 뇌졸중의 위험인자로써 고혈압, 당뇨병, 고콜레스테롤혈증 그리고 흡연력을 비교하였다. 고혈압은 기존에 고혈압을 진단받고 치료 중이거나 2회 이상 혈압을 측정하여 수축기 혈압이 140 mmHg, 이완기 혈압이 90 mmHg 이상인 경우로, 당뇨병은 기존에 당뇨병으로 진단받았거나 공복 시 혈당이 126 mg/dL 이상인 경우로, 고콜레스테롤혈증은 이전에 고지혈증으로 진단받아 치료 중인 환자들과 총 콜레스테롤이 220 mg/dL 이상인 경우로 정의하였다. 흡연에 대해서는 최근 5년간 흡연을 한 차례라도 한 경우는 흡연자로 분류하였다. 이외 자기공명사진상에서 혈관까지 평가하여 경동맥의 협착여부를 판단하였고 기존 내과에서 진단받고 치료받고 있는 병력 청취, 심전도, 홀터모니터 검사 그리고 심초음파 검사를 통해서 부정맥 및 판막질환 등을 포함한 심장질환 여부를 확인하였다.
본 연구의 모든 대상군의 신경학적 장애정도는 내원시와 뇌졸중 발생 2주 후에 National Institutes of Health Stroke Scale (NIHSS)을 이용하여 평가하였으며, modified Rankin scale (mRS) 을 퇴원시, 퇴원 후 3개월, 6개월 그리고 9개월에 4회 평가하였다. 또한 모든 대상군을 mRS과 혈중 D-이합체 농도에 따라서 다음과 같은 4개군으로 분류하였다. Group 1은 입원시 mRS 2 이하이고 D-이합체 0.5 미만인 경우, Group 2는 입원시 mRS 2 이하이고 D-이합체 0.5 µg/mL 이상인 경우, Group 3은 입원시 mRS 3 이상이고 D-이합체 0.5 µg/mL 미만인 경우 그리고 Group 4는 입원시 mRS 3 이상이고 D-이합체 0.5 µg/mL 이상인 경우로 하였다.
모든 대상군에서 혈중 D-이합체 농도를 뇌졸중 증상으로 내원시 측정하여 비교하였는데, 혈중 D-이합체에 대한 검사는 입원 후 최소한 12시간 이내에 정맥에서 혈액을 채취하여 즉시 0.11 mol/L 구연산 나트륨과 9:1 비율로 혼합하여 10분간 원심 분리(3000회/분)시킨 후 얻은 혈장에서 실시하였다. 혈중 D-이합체 농도의 정상치는 0.5 µg/mL 이하인 본원 기준치를 적용하였다.
통계 분석은 SPSS 18.0 프로그램(SPSS Inc., Chicago, IL, USA)을 사용하였다. 혈중 D-이합체 농도가 정규분포를 정확히 따르지 않아 연속 변수에 대해서는 Mann-Whitney U-test와 Kruskal-Wallis test를 사용하였고, 비연속 변수에 대해서는 chi-square 검정을 사용하여 통계 분석을 하였다.
결 과
본 연구에 참여한 모든 대상군은 총 242명이고 남자는 165명(68%)이었으며 평균 연령은 67.80±11.39였고 일반적인 임상 자료는 Table 1에 정리하였다. mRS와 혈중 D-이합체 를 통해 분류한 4개 각 집단군에서 모두 나이, 성별, 뇌졸중 위험인자들의 비교에서는 의미 있는 차이를 보이지 않았다. mRS 2 이하의 경증 집단인 Group 1과 Group 2 사이의 신경학적 예후에 대한 비교에서는 초기와 2주 뒤의 NIHSS 점수와 퇴원시, 3개월, 6개월 그리고 9개월 mRS에서 양 군의 의미 있는 차이를 보이지 않았다(Fig. 1) (Table 2). 이에 반해 mRS 3 이상인 중등도 이상의 증상을 보이는 집단인 Group 3과 Group 4의 비교에서는 약간의 흥미로운 차이를 보였다. 즉, NIHSS, 퇴원시 mRS, 퇴원 후 3개월과 6개월 mRS의 비교에서는 Group 3과 4L에서 모두 의미 있는 차이를 보이지 않았으나 퇴원 후 9개월 mRS에서는 Group 3은 3.08±1.31, Group 4는 3.62±1.38로 통계적으로 의미있는 차이를 보였다(P=0.039, Fig. 2). 이외 다른 변수에 대해서는 차이를 보이지 않았다(Table 3).
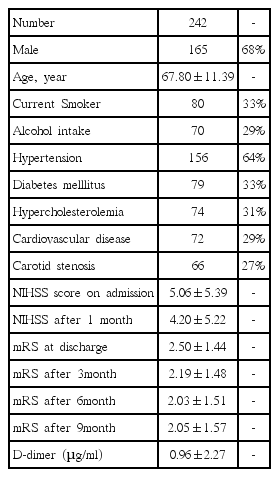
Baseline clinical characteristics of subjects
Comparison of mean value of mRS at discharge, 3-month, 6-month and 9-month follow-up visit between Group 1 and Group 2. The bar graph with the error bars represents the mean value of mRS and the associated 95% CI of the mean. A Mann-Whitney U-test comparing mean value of mRS at 4 times showed no differences between two groups. mRS: modified Rakin Scale; Group 1 is defined as subject group with mRS≤2 and d-dimer levels < 0.5 μg/mL; Group 2 is defined as subject group with mRS≤2 and d-dimer levels ≥ 0.5 μg/mL.
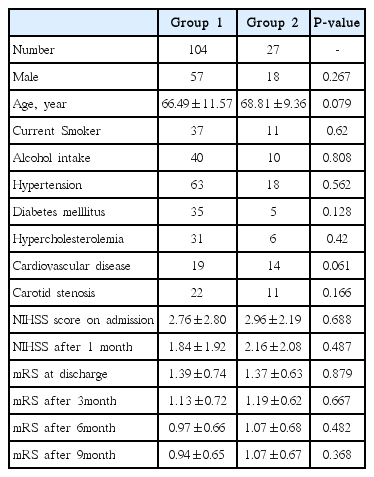
Association between d-dimer level and subjects with mild degree of disability (mRS ≤ 2)

Comparison of mean value of mRS at discharge, 3-month, 6-month and 9-month follow-up visit between Group 3 and Group 4. The bar graph with the error bars represents the mean value of mRS and the associated 95% CI of the mean. A Mann-Whitney U-test comparing mean value of mRS at discharge, 3-month and 6-month follow-up visit showed no differences between two groups. However, a significant difference of mean mRS at 9-month follow-up visit was observed between two groups (*P < 0.039). mRS: modified Rakin Scale; Group 3 is defined as subject group with mRS ≥ 3 and d-dimer levels < 0.5 μg/mL; Group 4 is defined as subject group with mRS ≥ 3 and ddimer levels ≥ 0.5 μg/mL.

Association between d-dimer level and subjects with moderate to severe degree of disability (mRS ≥ 3)
고 찰
혈전 색전성 질환의 발생과 관련을 가지는 응고계 및 섬유소용해계 (hemostatic and fibrinolytic system)의 주요 인자들 중에서 D-이합체는 깊은정맥혈전증, 폐색전증, 범발성 혈관내 응고장애, 심근 경색, 종양성 질환, 패혈증 등 혈전색전성 질환이 있는 경우 현저하게 상승하므로 이러한 질환을 평가하는데 유용하게 사용되고 있다[7,9,10]. 특히 정맥혈전색전증(venous thromboembolism), 깊은정맥혈전증(deep vein thrombosis), 폐색전증의 재발과 예후와 D-이합체의 혈중 농도의 증가와 연관성이 있다[11,12]. 특히 이전의 보고들에 의하면 혈중 D-이합체 농도가 높은 경우 정상 수준을 가진 경우에 비해 급성 심근경색증의 위험이 2배 이상을 보인다고 보고하며 관상동맥질환의 발병을 예측하는 위험인자로서 혈중 D-이합체를 제시하고 있어 D-이합체의 혈중 농도가 허혈성 뇌졸중에 있어서도 단기간과 장기간의 예후에 영향을 미칠 수 있다는 가설이 제시되고 있다[13-15]. 허혈성 뇌졸중에 대한 단기간의 예후에 대해서는 입원시 증가된 혈중 D-이합체 농도를 가진 환자군에서 초기 증상도 심하였고 퇴원 시에도 신경학적 예후가 나빴다고 보고하고 있다[16]. 또 다른 허혈성 뇌졸중에 대한 최근 연구들에서도 혈중 D-이합체 농도와 허혈성 뇌졸중의 예후의 연관성에 대해서 단기간에서 신경학적 증상의 악화와는 의미 있는 연관성이 있었다[8,17,18].
허혈성 뇌졸중 발생 이후 시간에 따른 혈중 D-이합체 농도의 변화에 대한 연구에서도 심색전성 뇌경색인 경우 발생 직후에 D-이합체는 상승하는 반면에 동맥경화성 뇌경색인 경우 뇌경색 발생 48시간째에는 상승이 보이지 않았으나 일주일 경과 시에 상승하였다[5,13,19]. 또한 열공성 뇌경색인 경우는 일주일의 시간이 경과해도 혈중 D-이합체의 상승을 보이지 않았다[19]. 그러나 D-이합체 혈중농도에 따른 장기간의 허헐성 뇌졸중 예후에 대한 연구는 아직까지 미미한 수준으로 Squizzato 등[13]은 장기적 임상적 예후와 연관성이 없다는 연구결과를 제시하기도 하였다. 따라서 혈중 D-이합체 농도와 허혈성 뇌졸중의 장기간의 신경학적 예후에 대한 연관성에 대한 연구는 지금까지 거의 시행되고 있지 않아 논쟁의 여지가 많이 있는 상태이다[13,20]. 본 연구에서는 허혈성 뇌졸중 증상의 심한 정도 및 입원 당시 혈중 D-이합체 농도와 무관하게 퇴원 시부터 6개월까지는 신경학적 증상의 심한 정도에 어떠한 차이를 보이지 않았다. 따라서 본 연구결과는 이전 보고들과 달리 혈중 D-이합체가 단기 신경학적 예후와 연관성도 보이지 않았다. 하지만 퇴원 후 9개월의 mRS에서는 초기 증상이 경증을 보인 군에서는 의미 있는 차이가 없었지만 mRS 3 이상의 중등도 이상의 신경학적 증상을 보인 환자군에서는 초기에 혈중 D-이합체가 높았던 군에서 더 심한 신경학적 후유증을 보였다. 본 연구를 통해 저자들은 초기에 심한 신경학적 증상을 가지는 허혈성 뇌졸중 환자에서 높은 혈중 D-이합체 농도는 장기간의 신경학적 임상적 예후와 의미 있는 연관성을 가질 수 있다는 가능성을 찾을 수 있었다.
본 연구에서 혈중 D-이합체 농도가 뇌졸중과 무관하게 아무런 증상이 없는 심방 세동을 가진 환자에서도 상승할 수 있어 이에 대한 영향을 받았을 가능성을 완전히 배제 할 수는 없었다. 이러한 제한점으로 인해 본 연구에서는 모든 연구 참여 군에 대해서 기본적인 심전도, 심초음파 및 24시간 홀터모니터 검사를 시행하였을 뿐만 아니라 심혈관내과 전문의들과 협진을 실시하여 이 문제를 최대한 극복하려 하였다. 또한 본 연구의 통계적 방법에서 다중비교보정을 시행하지 않아 type-І error의 확률이 증가하게 되어 거짓양성결과를 얻을 가능성도 있음을 생각해야겠다.
결론적으로 본 연구는 초기뿐만이 아니라 허혈성 뇌졸중 이 후 9개월까지의 뇌졸중 예후와 혈중 D-이합체의 연관성에 대한 연구로서 단기적인 예후뿐만 아니라 아직 논쟁거리를 많이 가지는 장기적 예후의 추정 가능성까지 평가 분석한 연구이다. 본 연구의 결과는 이전 국내외 보고들과 달리 혈중 D-이합체 농도가 단기간의 예후에는 의미 있는 관련성을 보이지 않았다. 흥미로운 결과는 초기에 신경학적 증상이 심하게 나타났던 허혈성 뇌졸중군에서는 혈중 D-이합체의 농도가 높을수록 9개월 이후의 장기적 신경학적 증상 후유증을 더 심하게 보였다는 것이다. 즉, 심한 신경학적 증상으로 시작한 허혈성 뇌졸중군에 있어서는 혈중 D-이합체의 농도가 장기 예후를 추정하는 의미 있는 인자로서 가능성을 보여주었다. 따라서 본 연구를 통해 저자들은 응급검사로 널리 사용되는 혈중 D-이합체 농도는 급성기 허혈성 뇌졸중에 있어서 장기 예후를 추정하는 인자로 역할을 할 수 있으리라 생각되며, 이를 좀 더 명확히 하기 위해서는 이에 대한 향후 관련된 대규모의 장기간 추적 연구들이 반드시 더 필요할 것으로 생각한다.