Cardiovascular Biomarkers during Acute Periods of Ischemic Stroke due to Non-Valvular Atrial Fibrillation
Article information
Abstract
Background
A subanalysis study of the ENGAGE AF-TIMI 48 trial showed that cardiac troponin I, N-terminal proB-type natriuretic peptide, and D-dimer, were powerful predictors of cerebrovascular adverse events. We aimed to evaluate D-dimer and cardiac troponin I levels during the acute period of ischemic stroke in anticoagulation-naïve patients with non-valvular atrial fibrillation (NVAF) and also studied the association between these biomarkers and stroke severity.
Methods
Consecutive anticoagulation-naïve patients with acute ischemic stroke due to NVAF were enrolled within two days after each stroke event, and all patients were stratified into either moderate-to-severe or mild neurologic deficit groups using the National Institutes of Health Stroke Scale (NIHSS) at admission.
Results
A total of 98 patients were enrolled in this study. The median value for the D-dimer was above the upper limit of the normal reference range, but the troponin I value was within the normal range for all patients. After adjusting for CHA2DS2-VASc risk factors, the log-transformed values for D-dimer were positively correlated with an increasing NIHSS score (r=0.233; P=0.051). In the multivariate logistic analysis, the log-transformed D-dimer was positively associated with more severe strokes (odds ratio, 30.1; 95% confidence interval [CI], 1.9-486.2 and 29.7; 95% CI, 2.0-430.8 in the upper two quartiles respectively). The log-transformed values for troponin I did not correlate with the NIHSS score.
Conclusion
D-dimer levels were higher and an independent risk factor for severe stroke in anticoagulation-naïve patients with NVAF related stroke. In contrast, troponin I levels were normal and were not associated with stroke severity.
INTRODUCTION
The most common risk stratification method used to predict embolic events in non-valvular atrial fibrillation (NVAF) is the CHA2DS2-VASc risk score, which is based on congestive heart failure, hypertension, age, diabetes mellitus, stroke, transient ischemic attack or thromboembolism, vascular disease, and female gender [1]. Because this method was developed based on demographic and epidemiological data, it lacked the pathophysiologic variables associated with NVAF thrombogenic mechanisms, such as atrial tissue damage, hypercoagulable state, and blood stasis [2]. Therefore, various biomarkers resulting from left atrial enlargement, inflammation, coagulation activity, hemodynamic stress, myocardial injury, and renal dysfunction have been included in clinical assessments and have been shown to be associated with an increased risk of adverse events for patients with AF [2,3].
Recently, several large phase 3 trials and one subanalysis study of the Safety and Effectiveness of Edoxaban (DU-176b) vs. Standard Practice of Dosing With Warfarin in Patients With Atrial Fibrillation (ENGAGE AF-TIMI 48) trial showed that cardiovascular biomarkers, in particular, cardiac troponin I, N-terminal proB-type natriuretic peptide, and D-dimer, were powerful predictors of cerebrovascular adverse events, and even higher predictors of deaths which were not reflected in CHA2DS2-VASc risk score [4].
In this study, we evaluated the troponin I and D-dimer levels during the acute stage of ischemic stroke in anticoagulation-naïve patients with NVAF to verify the implications of these biomarkers on cerebrovascular events, as shown in the above-mentioned subanalysis study. The fact that biomarkers are dynamic and change with time suggests the need to evaluate cardiovascular biomarkers just prior to or immediately after embolic events.
We also studied the association between these biomarkers and initial stroke severity. Hypothetically, an increase in biomarkers associated with higher blood stasis and hypercoagulability will predict larger thrombus formation and more severe neurologic deficits. Additionally, if there is a significant association between these biomarkers, they could be useful for predicting not only a simple embolic event, but also stroke severity, which is the most important prognostic factor for long-term functional outcomes.
METHODS
Patients
This study was approved by the ethics committee of Seoul St. Mary’s Hospital (No. KC14RISI0138). We used a prospectively collected stroke registry of all stroke patients admitted to the Seoul St. Mary’s Hospital Stroke database. Eligible patients were consecutive patients with acute ischemic stroke due to NVAF who were anticoagulation-naïve from September 2010 to September 2013. The characteristics and selection criteria of this study population were described in our previous study and are summarized below [2]. Patients who met all of the following inclusion criteria were enrolled: 1) ischemic stroke within 2 days after stroke onset based on clinical history and neurological examination with compatible new lesions on magnetic resonance (MR) diffusion-weighted images; 2) a medical history of AF or documentation of AF on continuous electrocardiographic monitoring in an emergency department or stroke unit and 24-hour Holter monitoring during admission regardless of AF pattern, such as paroxysmal, persistent, or permanent episodes; 3) not taking anticoagulation drugs currently or within the past 3 months with a normal activated partial thromboplastin time and prothrombin time international normalized ratio; and (4) no cardiac valvular disease on echocardiography. Patients were excluded if they had any of the following: 1) focal atherosclerotic stenosis of the vessels proximal to the ischemic lesions as a possible cause of artery-to-artery embolism; 2) any laboratory or clinical findings suggestive of infectious, inflammatory, vasculitic, demyelinating, or connective tissue diseases; 3) pre-existing significant disability (defined as a modified Rankin scale ≥2) from any condition; 4) history of stroke in the past 3 months; or 5) transient, reversible AF caused by hyperthyroidism or perioperative state (within 2 weeks of surgery).
All patients underwent a detailed clinical evaluation, including a neurological examination, laboratory tests, chest radiography, 12-lead electrocardiography, continuous electrocardiographic monitoring, 24-hour Holter monitoring, transthoracic and/or transesophageal echocardiography, brain magnetic resonance imaging, and contrast-enhanced MR angiography or computed tomography angiography.
Stroke severity assessment
Stroke severity was assessed at the time of admission using the National Institutes of Health Stroke Scale (NIHSS; scores range from 0 to 42, with higher scores indicating greater deficits) [5]. Ischemic stroke severity was dichotomized into either mild or moderate-to-severe neurologic deficit using an NIHSS score cutoff of 10 based on previous studies [6,7].
Biomarker assessment
Blood samples for measuring troponin I and serum D-dimer levels were obtained immediately after admission to the emergency department before any intravenous fluids or medications were administered. Cardiac troponin I was measured (ethylene-diamine-tetraacetic-acid plasma) using a commercially available sensitive assay (TnI-Ultra; Siemens Healthcare Diagnostics, Erlangen, Germany) with a lower detection limit of 0.006 ng/mL and an established 99th percentile reference limit of 0.04 ng/mL, with a coefficient of variation of 10% at a concentration of 0.03 ng/mL [8]. D-dimer was measured using an immunoturbidimetric assay (Innovance™ D-dimer; Sysmex Coagulation Analyzer, Erlangen, Germany) with an upper reference range limit of 0.5 pg/mL.
Statistical analyses
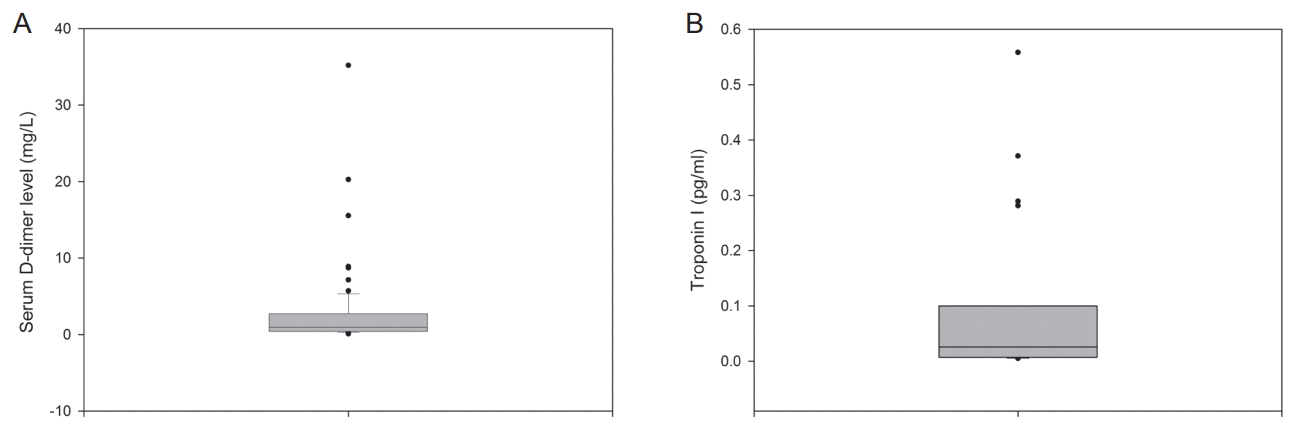
Statistical analyses were performed using SPSS for Windows version 17.0 (SPSS Inc., Chicago, IL, USA). Pearson’s χ2 test, an independent sample t -test, and Fisher’s exact test were appropriately used. Because D-dimer and troponin I value distributions were markedly right- skewed (Fig. 1), data transformations using a natural logarithm were performed to reduce right skewness, and log-transformed values were used for further analysis. Correlations between the log-transformed values for troponin I/D-dimer and NIHSS score were determined using a partial correlation coefficient adjusted for CHA2DS2-VASc risk factors.

Box plots for D-dimer (A) and troponin I (B) levels. The horizontal line inside each box indicates the median, the top and bottom of the box indicate the interquartile range, the I bars indicate the 5th and 95th percentiles, and circles indicate outliers.
The log-transformed values for troponin I and D-dimer were divided by quartile (Q1, Q2, Q3, and Q4), and odds ratios were calculated for moderate-to-severe neurological deficits (defined as NIHSS ≥10), using logistic multivariate regression analysis adjusted for CHA2DS2-VASc risk factors. The area of the Receiver Operation Characteristic Curve (ROC) and the cutoff value of the serum D-dimer level for the severe neurologic deficit (NIHSS ≥10) were also determined.
RESULTS
Baseline characteristics
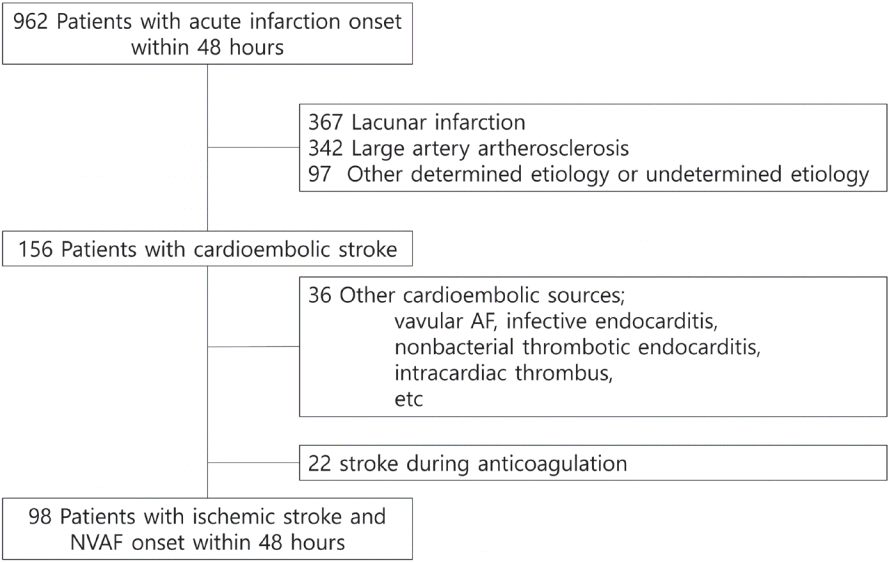
A total of 98 consecutive anticoagulation-naïve patients with acute infarction due to NVAF were enrolled in this subanalysis of the ENGAGE-AF TIMI 48 trial (Fig. 2). The study population included 64 (65.3%) men and the mean age at baseline examination was 72.2±9.1 years (range, 46-92). Hypertension (n=63, 64.3%) was the most frequent vascular risk factor, followed by smoking (n=37, 37.8%), diabetes mellitus (n=25, 25.5%), dyslipidemia (n=20, 20.4%), ischemic heart disease (n=19, 19.4%), previous stroke (n=12, 12.2%), and peripheral vascular disease (n=2, 2%). The median body mass index was 23.8±3.5 kg/m2 (range, 16-36). Table 1 shows the clinical and demographic characteristics for the mild neurologic deficit group, moderate-to-severe neurologic deficit group, and entire study population. Among the total number of 98 ischemic stroke patients, 61 patients were identified as having a mild neurologic deficit, and 37 patients were identified as having moderate-to-severe neurologic deficits.

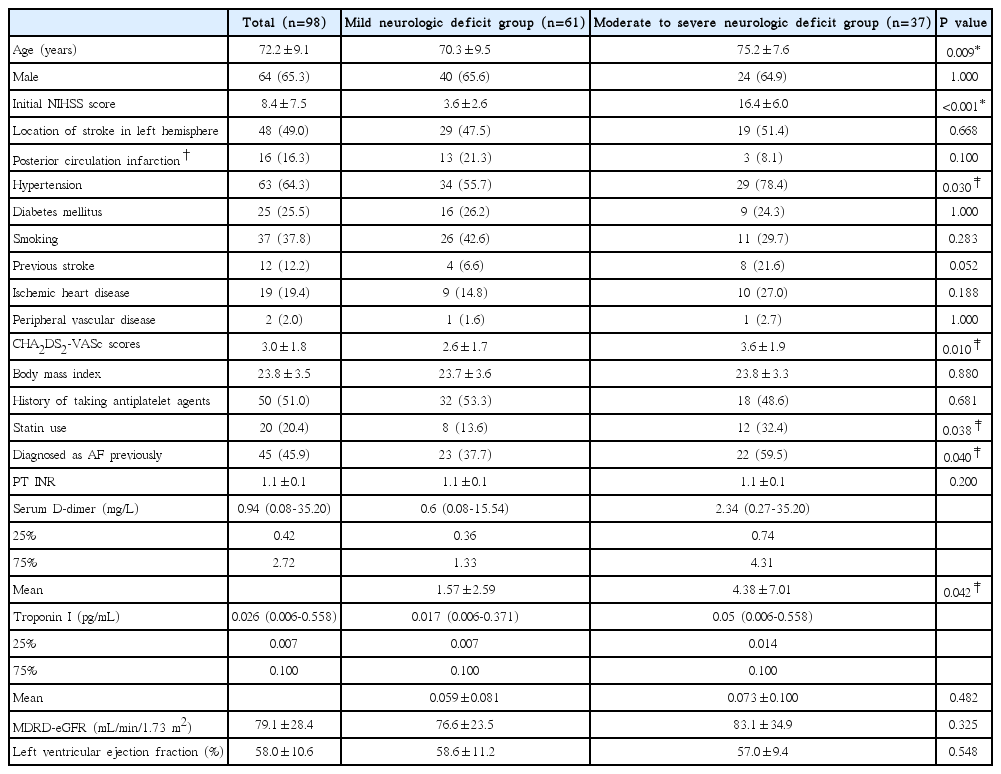
Demographic and clinical characteristics of mild neurologic deficit (NIHSS <10) versus moderate to severe (defined as NIHSS≥10) groups in patients with ischemic stroke and non-valvular AF
A comparison of the percentages of right hemispheric lesions between the mild and moderate-to-severe neurologic deficit groups (48.6% vs. 52.5%) showed no significant differences. Although the proportion of patients with posterior circulation infarction (infarction in the vertebral, basilar, or posterior cerebral artery territories) was larger in the mild neurologic deficit group than in the moderateto-severe neurologic deficit group (21.3% vs. 8.1%), the difference did not achieve statistical significance (P=0.100 by Fisher’s exact test).
Distribution of serum D-dimer and troponin I levels
The median values for serum D-dimer levels were 0.94, 0.60, and 2.34 mg/L for all enrolled patients i.e., the mild neurologic deficit group, and the moderate-to-severe neurologic deficit group, respectively, and all these median values were above the upper limit of the normal reference range (Table 1). Mean D-dimer levels were significantly higher in the moderate-to-severe neurologic deficit group compared to the mild group (4.38±7.01 vs. 1.57±2.59; P=0.042). The interquartile range (IQR, 0.42-2.72 mg/L) and box plots are shown in Fig. 1A. The distribution of serum D-dimer levels was markedly right skewed as shown in Fig. 1B.
The median values for troponin I levels were 0.026, 0.017, and 0.05 pg/mL, respectively, for all study subjects and subgroups i.e., the mild neurologic deficit group, and the moderate-to-severe neurologic deficit group, respectively. Although the median values of troponin I among all enrolled patients and the mild neurologic deficit group were within the normal reference range, this value was above the upper limit for the normal reference range (0.04 mg/L) in the moderate-to-severe neurologic deficit group (Table 1) [8]. Mean troponin I values were not significantly different between the mild and moderate-to-severe neurologic deficit groups. The IQR of troponin I was 0.007-0.100 pg/mL. The distribution of troponin I levels also showed severe right skewness, as seen in Fig. 1B.
Correlation between biomarkers and stroke severity
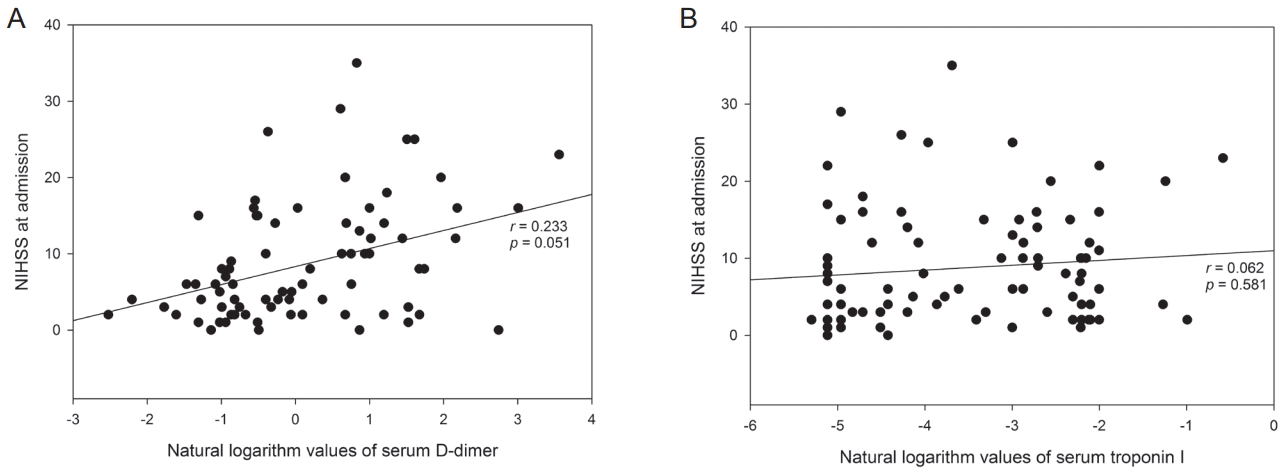
The partial correlation coefficient analysis adjusted for CHA2DS2-VASc risk factors showed the log-transformed values of D-dimer were positively correlated with increasing NIHSS score (r=0.233; P=0.051) (Fig. 3A). The log-transformed values for troponin I did not correlate with the NIHSS score (r=0.062; P=0.581) (Fig. 3B).

Scatterplot graph with a regression line between the log-transformed values of D-dimer and NIHSS at admission (A), and between the log-transformed values of troponin I and NIHSS at admission (B). Analyses were performed using partial correlation coefficient analysis adjusted for CHA2DS2-VASc risk factors.
Biomarkers as a prognostic risk factor for severe neurologic deficit
When compared to patients with the lowest log-transformed D-dimer (<0.87) after adjustment for CHA2DS2-VASc risk factors, patients in the upper two quartiles (Q3 and Q4) had higher odds for more severe strokes (Table 2). Odds ratios were 30.1 (95% confidence interval [CI], 1.9-486.2, P=0.017) and 29.7 (95% CI, 2.0-430.8, P=0.013) when the log-transformed D-dimer ranged from -0.06 to 1.00 and ≥1.00, respectively. The area of the ROC for the serum D-dimer was 0.76 (P <0.001) and when the cutoff value of serum D-dimer level for the severe neurologic deficit (NIHSS ≥10) was determined as 1.64 mg/L, the sensitivity, and the specificity were 70% and 78%, respectively.

Independent associations of the natural logarithm values of serum D-dimer level (mg/L) and troponin I (pg/mL) with moderate to severe neurologic deficit (NIHSS ≥10)
Compared with the lowest quartile of the log-transformed troponin I value (-4.96) adjusted for CHA2DS2-VASc risk factors, only patients in the second upper quartile (Q3) had a significantly higher odds ratio for severe stroke (6.5; 95% CI, 1.3-32.1; P=0.021), when assessing the impact of troponin I levels. The first and third (Q4 and Q1) upper quartiles did not have significant odds of a more severe stroke.
DISCUSSION
In this study, we evaluated dynamically changing cardiovascular biomarkers during the acute period of ischemic stroke due to NVAF in anticoagulation-naïve patients. The median D-dimer levels in all enrolled patients were higher than the normal reference range upper limit. An increasing D-dimer level could be independently correlated with stroke severity and the upper first and second quartiles of the D-dimer level were associated with significantly higher odds ratios for severe ischemic stroke (defined as NIHSS ≥10) compared to the lowest quartile.
In contrast, troponin I showed inconsistent results. Although patients with moderate-to-severe ischemic stroke had troponin I levels that were higher than the upper limit of the normal reference range, the mild stroke group had normal troponin I values and the overall troponin I level in all enrolled patients was within the normal reference range. The risk for a severe ischemic stroke was only significant in the second upper troponin I quartile, while the first and third upper quartiles were not significantly associated with severe stroke.
In addition to CHA2DS2-VASc scores, potential areas of further risk stratification in NVAF exist, using various biomarkers and imaging techniques [2,4]. Because thrombogenesis in NVAF is driven in part by inflammation, atrial tissue damage, hypercoagulable state, and blood stasis, it is reasonable to hypothesize that there may exist markers for thrombogenic conditions, possibly prior to the onset of severe stroke. D-dimer is a byproduct of the degradation of fibrin and reflects thrombin and fibrin turnover. With regard to thrombogenesis in patients with AF, the D-dimer level is one of the surrogate markers for the hypercoagulable state, which is one component of Virchow’s triad [9,10]. Use of the D-dimer level as a reflection of the thrombogenic condition and thrombus burden in patients with AF, has been further supported by findings that high serum D-dimer levels in AF were reduced by anticoagulation and cardioversion to sinus rhythm [11,12].
Our findings in terms of D-dimer are in line with previous studies and the recent subanalysis study of the ENGAGE AF-TIMI 48 trial showing that a higher D-dimer value was associated with increased risk for adverse cerebrovascular events [4,13-17]. Several researchers have also reported the cross-sectional association between D-dimer levels and stroke severity in prior studies [18-20]. However, most of these cross-sectional studies included the patients with ischemic stroke from heterogeneous etiologies and did not focus only on the cardioembolic stroke. In addition, while those studies did not measure the troponin I levels, our study measured troponin I levels, as well as D-dimer levels simultaneously, so that it could provide support for the validity of these biomarkers in predicting adverse embolic events, as shown in the recent subanalysis study of the ENGAGE AF-TIMI 48 trial [4]. The anticoagulation-naïve status of the entire study population was also an advantage over other studies, since anticoagulation reduces biomarker levels [11], but this also led to a small number of enrolled patients, because anticoagulation-naïve acute ischemic stroke patients with previously diagnosed AF or newly diagnosed AF were less common than expected.
With regard to troponin I, the subanalysis study of the ENGAGE AF-TIMI 48 trial showed a consistently significant association with the incidence of embolic events [4]. However, the cross-sectional values in an acute period of stroke in this study were not higher than the normal upper limit in most patients, and did not show a significant association with stroke severity in contrast to the D-dimer level. For the acute period of the ischemic stroke, D-dimer seemed to be more significantly associated with NVAF-related ischemic stroke compared to troponin I. Perhaps it could be one of the plausible explanations for this discrepancy that D-dimer is the direct byproduct of fibrin, reflecting the thrombus burden itself; therefore, it has more advantages than troponin I in evaluating the relevant aspects of thrombus burden, such as stroke severity, while troponin I is just a cardiac and skeletal muscle protein. We believe that it is reasonable to hypothesize that these biomarkers could be used to predict the future cardiovascular adverse event prospectively.
Cardioembolic infarction is particularly known to be associated with more severe stroke morbidity and mortality compared to other stroke etiologies, such as large artery atherosclerosis. For these reasons, evaluating the risk factors for more severe ischemic stroke in AF can potentially help prevent long-term poor functional individual outcomes, as well as reduce medical expenses and the burden of long-term care for poor functional patients. When we consider individualized treatment for the prevention of ischemic stroke in patients with AF and high D-dimer levels, it is possible that the treatment plan could be optimized in relation to D-dimer levels. However, one study showed that, while D-dimer levels were higher in patients with severe stroke after adjusting for confounding factors, this was not statistically significant [21]. Further large studies are necessary to address the exact relationship between D-dimer levels and stroke severity.
CONCLUSION
D-dimer levels were higher in anticoagulation-naïve patients with acute ischemic stroke due to NVAF and an increased D-dimer level was significantly associated with more severe initial neurologic deficits compared to lower D-dimer levels. In contrast, troponin I was not consistently associated with stroke severity.
Notes
The authors have no financial conflicts of interest.
