Cerebral fat embolism in sickle cell disease
Article information

A 22-year-old man with a history of homozygous sickle cell disease was admitted to the intensive care unit for acute chest syndrome defined with radiodensity on chest imaging, fever, and respiratory symptoms. Within a few hours, the patient developed altered consciousness, necessitating intubation.
Hematological testing revealed pancytopenia (white blood cell count, 2 ×10⁹/L; hemoglobin, 8 g/dL; platelet count, 40 ×109/L; reticulocyte count, <100 ×109/L), likely caused by bone marrow necrosis. Cerebral magnetic resonance imaging (MRI) performed on day 1 of admission revealed bilateral punctate foci of restricted diffusion in the supratentorial white matter on diffusion-weighted imaging without vascular systematization or evidence of collateral flow on fluid- attenuated inversion recovery sequence (Fig. 1A-C). Computed tomography and MR angiography of the supra-aortic trunk and intracranial vessels yielded normal findings. Without an alternative diagnosis, cerebral fat embolism syndrome (CFES) following bone marrow necrosis was suspected despite the absence of hyperintensity on susceptibility-weighted imaging (Fig. 1D).
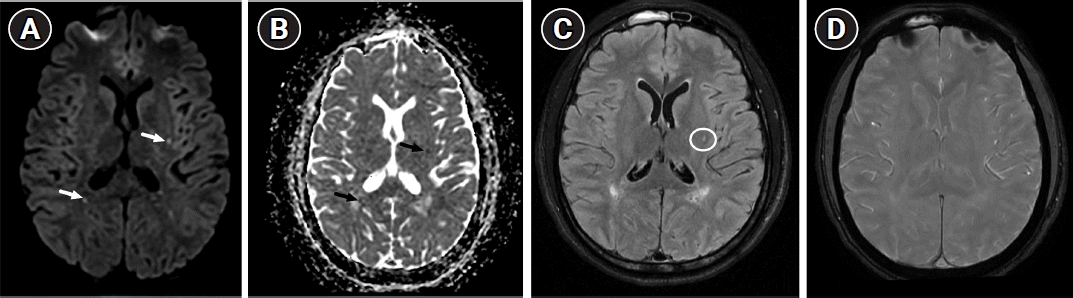
Initial axial brain magnetic resonance imaging performed 24 hours after admission. (A) Diffusion-weighted imaging (b=1,000 sec/mm2) and (B) the corresponding apparent diffusion coefficient map revealing bilateral scattered punctate foci of restricted diffusion of the supratentorial white matter (arrows). (C) Fluid-attenuated inversion recovery sequence showing hyperintensity of a left putamenal lesion without evidence of collateral flow (circle). (D) Susceptibility-weighted imaging sequence showing no hypointense area in the brain.
A second MRI performed on day 26 due to persistent coma revealed countless microbleeds of the entire white matter displaying a “walnut kernel microbleed pattern” predominant in the posterior arms of the internal capsules, and in the splenium of the corpus callosum, suggestive of an extensive CFES. Moreover, bilateral hyperintensity with restricted diffusion in the head of the caudate and putamen suggested secondary hypoxic-ischemic encephalopathy (Fig. 2A-D) due to fat embolism in the absence of a cardiac origin.
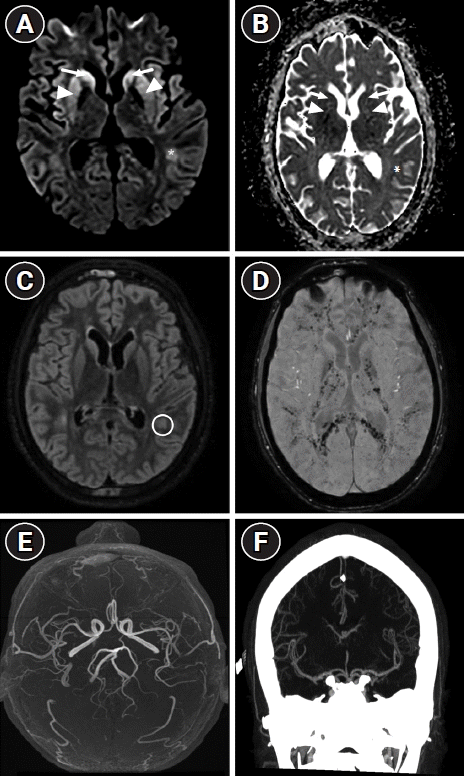
Second axial brain magnetic resonance imaging performed 26 days after admission. (A) Diffusion-weighted imaging and (B) the corresponding apparent diffusion coefficient map showing bilateral hyperintensity with restricted diffusion of the head of caudate (arrows) and putamen (arrowheads), and left occipital subcortical white matter (asterisks) suggesting additional hypoxic-ischemic encephalopathy. (C) Fluid-attenuated inversion recovery sequence showing hyperintensity of a left occipital white matter lesion (circle) without evidence of collateral flow. (D) The susceptibility-weighted Imaging sequence reveals widespread and consistent pinpoint susceptibilities within the gray matter, gray-white junction, posterior arms of the internal capsules, the splenium of the corpus callosum, basal ganglia, and thalami. This presentation is characteristic of the "walnut kernel microbleed pattern," which strongly indicates cerebral fat embolism. (E, F) The corresponding three-dimensional time-of-flight angiography and computed tomography angiography revealing no abnormalities of intracranial vessels.
Echocardiography revealed normal findings, and the cardiac rhythm remained sinus on multiple electrocardiograms. MRI and computed tomography angiography revealed no abnormalities (Fig. 2E and F). Although rare, CFES should be considered in SCD patients with altered consciousness [1-3].
Notes
Ethics statement
The French law does not require an institutional review board's approval for the diffusion of a medical image, or other clinical data collected in the context of the medical care provided during a patient stay in the department, as long as it is confidential. The patient's next of care have been informed, and signed a consent form for publication.
Conflict of interest
No potential conflict of interest relevant to this article.
Author contributions
Writing–original draft: all authors. Writing–review & editing: all authors.